|
MITEN LÖYDÄN PARHAAN TIEDON ANALYYSISTÄ?
How to get the best possible info from the analyzer?
Jokaisella tietysti on oma tapansa lukea tilastoita ja en halua
siihen tapaan sen enempää puuttua. Kerron tässä miten tästä
Analyysi taulukosta saa eniten irti ja pääse nopeinten eteenpäin
tutkimaan mistä tällainen kokonaisluku kertyy. Tilastoa voi
hyödyntää sekä oman joukkueen valmennuksessa ja valmistautuessa
tulevaan – vakoilla toisen tapoja.
Each one of us has routine to read statistical information. We try
to tell what would be the quickest way for one to realise wherefrom
some numbers are born. Statistics can be useful not only to learn
more of your own team, but to scout the ways the other team is good
or not that good and use it in the next game.
Kannatan ajattelua kokonaisuuksista osiin.
We like to think from the totality to details
Pelaajatilastojen alla on ”Analyysin” sydän. Eli mitä
ottelussa on joukkueen näköpiiristä tapahtunut. Vasen ja oikea laita
kertoo sen miten kotijoukkueen tilastoijat seuraavat ottelua ja
tulevatko levypallot ja heitot oikein huomioitua. Jos haluat heitä
tässä ohjata, voit esittää ”Analyysin” myös heille.
Under individual statistics you will find”The heart of Analyzer”.
That is to say what really happened in the team during the game? The
left and right sides are more to the person keeping the stats How
they see the game and are the rebounding plus shooting correctly
done. If you need to tell them about this- please do so.
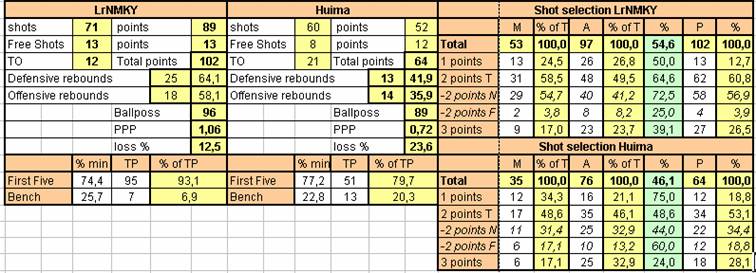
Vasemmalla seuraavana on koti ja vierasjoukkueen kokonaisanalyysi.
Next on left you find the full analyze of the home and visiting team
-
Shots and points
-
Kahden ja
kolmenpisteen heittojen lukumäärä ja niistä tulleet pisteet
-
The whole amount of two and three points shots and given points
-
Free shots
-
Vapaaheittojen
määrä / 2 ja vapaaheitoista saadut pisteet
-
The whole amount of free throws and given points
-
TO
-
Menetysten kokonaismäärä
-
The
amount
of
turnovers
-
Total
points
-
Saavutettu kokonaispistemäärä
-
Total
points
-
Defensive rebounds
-
Kokonaismäärä
ja % -osuus puolustuskorilla olleista irtopalloista
-
Total
and the
percentage
of the
loose ball at
defensive
board
-
Offensive
rebounds
-
Kokonaismäärä ja % -osuus hyökkäyskorilla olleista irtopalloista
-
Total and percentage of the loose balls in offensive board
-
Ball possessions
-
Pallonhallinnat (2+3 pisteen yritykset + vapaaheitot/2+
menetykset)
-
(2 + 3
points
attemts + FT/2 + TO)
-
PPP
-
Saavutettu pistemäärä per pallonhallinta
-
Points
per
possessions
-
Loss %
-
Menetysten % osuus pallonhallinnoista
-
TO % of the
ball
possessions
-
First Five
-
Aloitusviisikon
% osuus peliminuuteista, tehdyt pisteet ja % -osuus
kokonaisuudesta
-
First five player % in minutes, made points and % of the whole
-
Bench
-
Vaihtopelaajien % -osuus peliminuuteista, tehdyt pisteet ja %
-osuus kokonaisuudesta
-
Bench players % in minutes, made points and % of the whole
Miten
lukea:
Reading:
Pallonhallinnat, mistä ne ovat tulleet ja paljonko niitä on annettu
vastustajalle, antavat kokonaiskuvan sekä hyökkäyksestä että
puolustuksesta. Nykyisen suuntaisessa tempoherkässä koripallossa
hyökkäyshallintoja on hyvällä joukkueelle 95–110 ja vastustaja on
silloin pyrittävä pitämään 75 ja 90 välillä.
In the basketball game of to day the ball possessions give you a
clear picture of offense as well as of defense. In offense the
number should be 95-110 and to have good defense you should keep the
other team between 75-90.
PPP
- maksimi voi olla 3 pistettä – kertoo menetysten osuudesta ja
heittojen onnistumisesta ja loss % täsmentää ppp:n jo kertomaa.
PPP
– maximal number can be 3. It tells about how we handle and pass the
basketball (TO) and how well we shoot.
Viisikon käyttö kertoo pitkällä aikajänteellä joukkueen
pelityylistä, vaihtojen lukumäärästä sekä antaa kuvan aloitus- ja
penkkipelaajien tehokkuudesta pisteiden tekemisessä. Onko
penkkipelaajan tehtävä kentälle tullessa esim. vain puolustaa vai
onko penkillä myös korintekijöitä.
Using the first five and your bench tell us in the long run about he
the numbers of the substitutions and gives also the effectiveness of
the starting line up compared to the bench players. Do we only have
defensive subs or do we also have some future scorers in there.
Oikealla oleva Shot selection taulukko kertoo miten joukkue
tekee pisteensä. Pelataanko sisälle, ajetaanko korille vai
heitelläänkö vain kolmosia Joukkue, joka heittää esim. paljon 4-6 m
kakkosia kertoo, jonkun pelaajan olevan erityisen hanakka ns. Pull
up heittäjä. Toisaalta taulukko voi kertoa myös toisen joukkueen
erityisen hyvästä tai huonosta puolustuksesta kyseisellä
osa-alueella. Virhe herkkyydestä tai osataanko kalastella virheitä
ja mikä on kunkin korintekotavan teho.
The Shot selection chart on the right tells about team’s way
of scoring. Do they play inside, penetrate or do they only shoot
three pointers. Team that shoots a lot of 4-6 meter two pointers
tells about that they might have some good Pull up shooter.
On the other hand the chart might also tell teams effective way of
playing defense in some special area –maybe a zone makes the others
to shoot a lot outside. Tendency to take fouls or “fish” them can
also be seen in chart. In the long run it tells the effectiveness
of team’s way of scoring and maybe the right way of scoring if there
is one.
|